Monitor
Know if it is up, fast, and still yours.
- Websites
- Uptime / Reliability
- Performance
- SSL
- Domains
- DNS
- APIs
- Cron Jobs
- Synthetic
- Load test
Watch uptime, performance, SSL, DNS, security, privacy and SEO from one workspace — then alert your team, or your clients, the moment something changes.
Example result · google.com
Response time
128 ms
SSL certificate
Valid · 68 days
Sign up to run live checks with snapshots, logs and forecasting for your own sites.
Keeping watch over 0 sites, running 0 checks for 0 people who sleep better at night.
Setup
Copy and paste your website URL
Any address you already have. Nothing to install on the site.
Press Add
The first check starts immediately. Alerts, reports and the rest can wait until you want them.
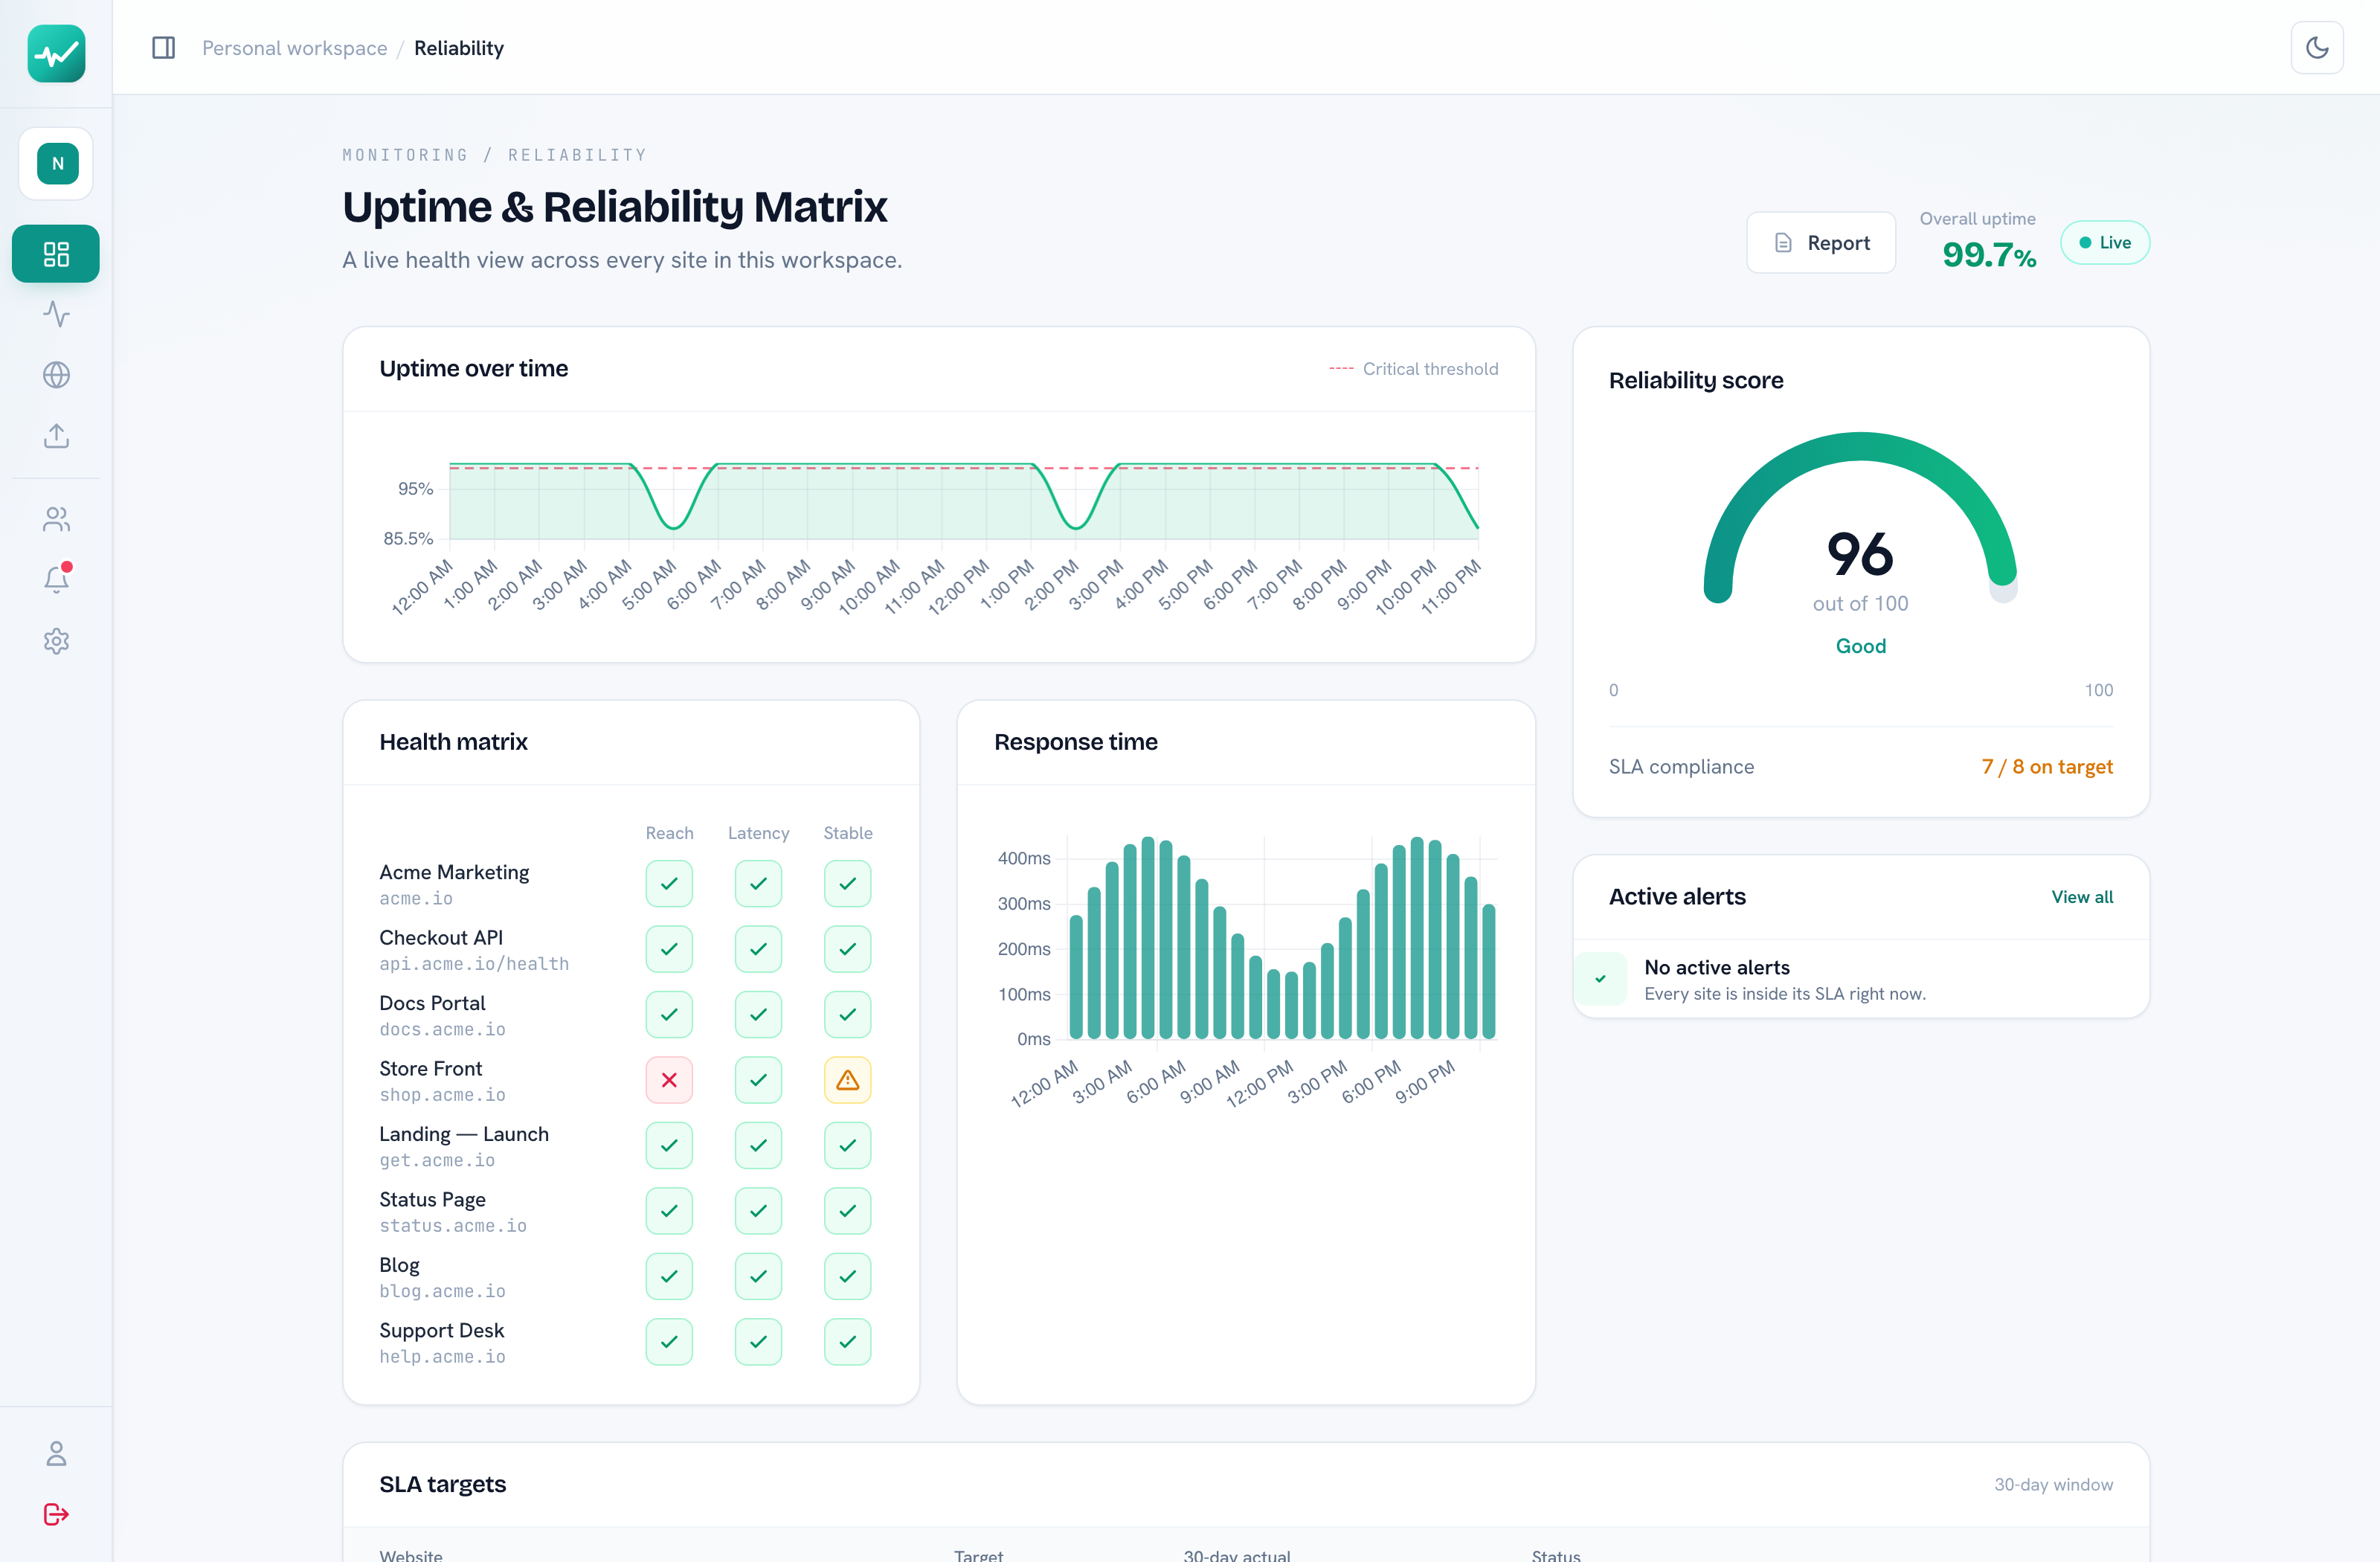
A single reliability score, a live health matrix per site, uptime and latency over time, and every incident in one place — so you spot trouble before it spreads.
Reliability score
A weighted read on how healthy everything is right now.
Health matrix
Reachability, latency and stability for each site, colour-coded.
SLA targets
Set a target per site and see who is on track or breached.
See every service at a glance — status, latency and last check, updated continuously.
| Service | Status | Response time | Last checked |
|---|---|---|---|
| Marketing Site | Operational | 42ms | Just now |
| Authentication API | Operational | 115ms | 1 min ago |
| Billing Service | Degraded | 1450ms | 2 mins ago |
| Background Workers | Operational | 88ms | 5 mins ago |
The same tools you open inside the product, by the names you will see them. Add a site, then watch it, inspect it, and tell the right people what you found.
Know if it is up, fast, and still yours.
See what is exposed, weak, or misconfigured.
See who is collecting data on the page.
Keep frameworks, evidence and risks in one place.
Catch broken on-page basics before they cost you traffic.
Hand someone a written picture of how the sites are doing.
The right channel fires the moment something changes.
Share the work, or give clients a view of their own sites.
A closer look
Resolve A, AAAA, CNAME, MX, TXT, NS, SOA, CAA, PTR, SRV and DNSSEC. Automatically detects missing records, SPF lookup exhaustion (>10), and alerts your team the second an IP or nameserver changes.
Deep SPF syntax and include-chain validation, automatic DKIM provider detection (Google Workspace, M365, SendGrid, Mailgun, Amazon SES), DMARC policy enforcement, and reputation monitoring across global DNSBL blacklists.
Comprehensive HTTPS and SSL certificate verification, redirect chain tracking, and automated scoring of critical defense headers: CSP, HSTS, X-Frame-Options, X-Content-Type-Options, and Referrer-Policy.
Audit insecure cookies (missing Secure, HttpOnly, SameSite flags), server information disclosure, unsafe CORS policies, directory listings, exposed configuration files, publicly accessible .git repositories, and outdated libraries.
Proactively probes target domains for exposed administrative portals (/admin, /wp-admin, /login), XML-RPC APIs, debug traces, source maps (.js.map), backup archives, and leaked staging environments.
Instant SEO health analyzer verifying titles, meta descriptions, heading hierarchy (H1/H2), canonical URLs, robots.txt, sitemap.xml, Open Graph, Twitter cards, Schema.org JSON-LD, broken links, and image alt tags.
Multi-vector fingerprinting for CMS (WordPress, Shopify, Drupal), web frameworks (Next.js, React, Laravel, Vue, Django), servers (Nginx, Apache, Cloudflare), cloud hosting, and analytics scripts with change alerts.
Give your background workers, database backup tasks, and scheduled jobs a ping URL (webchecky.com/heartbeat/abc123). If the heartbeat doesn't arrive on schedule, WebChecky alerts your team immediately.
Generate multi-page executive client audit PDFs with your agency name, custom logo, brand color palettes, client name, custom notes, and verified WebChecky footer certifications.
Drive real headless browser interactions through checkouts, logins, and multi-step forms. When a step breaks, get alerted with a full-page screenshot of the exact failure state with masked credentials.
Real-time measurements for LCP, CLS, TTFB, FCP, page weight, request counts, and 30-day response latency charts with AI-powered 72-hour outage risk forecasting.
Download our lightweight single-binary webchecky-agent for Windows, macOS, and Linux to monitor internal dashboards behind VPNs, office LANs, and localhost with native desktop alerts.
Synthetic monitoring
A 200 OK doesn’t mean customers can sign in. Synthetic checks drive a real browser through the whole journey — log in, click through, add to cart — and page you the moment a step breaks, with a screenshot of exactly where.
Real user journeys
Chain navigate, fill, click, wait and assert into a login or checkout flow. Start from a one-click template, then edit.
Fails exactly where it breaks
If any step fails the site is marked down and we capture a screenshot at that step — password fields masked.
Credentials, handled
Logins are encrypted at rest and referenced safely in any step. Auto-detect selectors straight from your own page.
Login working
All 5 steps passed · 1.9s
navigate /login
fill email field
fill password field
click Sign in button
assert “Dashboard” visible
Passed
Stayed within all thresholds.
12,480
Requests
416
Req / s
214ms
p95 latency
0.2%
Errors
Minimal load testing
Not a full stress-testing rig — a fast, bounded burst of virtual users (up to 100, for up to a minute) you fire at any site right from its dashboard. Enough to spot-check before a launch or a campaign, with a plain-English verdict.
Bounded and safe
Hard caps — up to 100 virtual users for up to 60 seconds — with automatic abort the moment the target starts failing. A smoke test, not a siege.
The numbers that matter
Requests per second, p50–p99 latency, time-to-first-byte and error rate — charted second by second.
A clear pass or fail
Set a p95 and error-budget target and get a verdict, plus a plain-language read on what slowed down and why.
Internal dashboards, staging behind a VPN, a box on the office LAN, even localhost — download a tiny agent that checks them from your own machine and network, and pings your desktop the instant one drops.
Runs on your network
Reaches firewalled and internal sites a cloud checker never could.
Native desktop alerts
A real Windows / macOS / Linux notification the moment a site goes down.
Everything still syncs
Results flow to your dashboard and fire email + Slack / Discord / Teams as normal.
$ webchecky-agent run
WebChecky Agent v0.1.0 — connected
[09:14:02] Internal Dashboard ONLINE
[09:14:02] Staging (VPN) ONLINE
[09:14:03] Grafana · LAN ONLINE
[09:14:03] Checkout API DOWN
↳ Connection refused
WebChecky · site down
Checkout API is down
Connection refused · just now
Email plus Slack, Discord and Microsoft Teams — connected in a couple of clicks. Recovery and SSL/domain-expiry alerts too. And your public status page can email its own subscribers automatically.
Website down
status.example.com is not responding (503)
Recovered
api.example.com is back online
SSL expiring
store.example.com certificate expires in 12 days
Paste a URL — or bulk-import a whole list. No agents, no DNS changes, nothing to install.
Uptime, SSL, domain and response time, checked from the cloud on the interval you set — from seconds up to minutes.
The instant something breaks, the right people hear about it — with the reason and a timestamp.
Public status pages
Share a clean status page with live components, a 90-day uptime calendar and a real incident timeline. Visitors can subscribe to get emailed the moment something changes.
Personal & team workspaces
Keep your own sites in a personal workspace, or create teams with Admin, Editor and Member roles. Switch between them from the top bar — everyone who should know, knows.
Every plan includes the features turned on for it. No credit card to start.
Everything worth knowing before you start.
Paste the URL and press Add. The first check runs immediately. A display name is optional. To add a list, use bulk import from a file or a paste.
On the free plan, websites are checked every 15 minutes automatically, and you can run a manual check any time from the dashboard. You can also set the interval yourself, from seconds up to minutes
You can add as many sites as you want, and run a manual check on any of them. Automatic monitoring follows the plan: 15 sites on Free, 50 on Pro, and 100 on Agency. The pricing cards above show the live allowance, including any change an admin has made.
Uptime and reliability, performance, SSL certificates, email alerts, and teams. No credit card to start. The cards above are the exact list turned on right now.
Pro adds DNS and domain expiry, API monitoring, cron jobs, the security suite, the privacy suite, SEO, reports and digests, Slack, Discord, Microsoft Teams and webhooks, status pages, and compliance. Agency adds the client portal and white label.
An alert is sent after two failed checks in a row, so a single blip does not page you. It includes the reason, the response code and the time. Email and an in-app notification are on every plan.
Email and in-app notifications are on every plan. Slack, Discord, Microsoft Teams and webhooks are on Pro.
SSL certificate expiry is tracked on every plan, with a warning before it lapses. Domain expiry and DNS record changes, including an IP or nameserver change, are on Pro.
Yes. On a site you can set a phrase the page must contain, and a phrase it must not contain, such as an error message. A check that fails those rules is treated as a problem.
Yes. A maintenance window keeps planned work out of your uptime figures and stops it from raising an outage alert. You can also schedule and cancel windows through the API.
Yes. Turn monitoring off for a site from the websites list. It stays in your account, and you can still run a manual check. Turn it back on when you want automatic checks again.
On Pro: HTTPS, defense headers, TLS hardening, OWASP checks, email security (SPF, DKIM and DMARC), exposed admin paths and files, and the technology stack, with an alert when that stack changes.
On Pro: cookies, trackers, what the page collects, consent banners, and third parties.
On Pro. Titles, meta descriptions, headings, canonical URLs, robots.txt, the sitemap, Open Graph, schema, broken links and missing image alt text.
On Pro: assessments, frameworks, risks, remediation, evidence, a policy analyzer, policies, vendors, incidents and privacy requests, in one workspace.
On Pro. API endpoints are watched the same way as websites. A cron job or backup gets a ping URL, and you are alerted if the heartbeat does not arrive on schedule.
On Pro: a reliability report, performance reports, scheduled digests, and a custom report.
Yes, on Pro. A public page with components, a 90-day uptime calendar, an incident timeline, and email subscriptions for visitors.
Yes. You start with a personal workspace, and you can create teams with Admin, Editor and Member roles. Each team has its own plan, and you switch workspace from the sidebar.
On Agency. The client portal shows a client the sites you watch for them, without the rest of your account. White label puts your name, logo and colors on reports and status pages.
Yes. From a site's page you can run a bounded load test: up to 100 virtual users for up to 60 seconds, with optional latency and error targets. You get a pass or fail and per-second charts. It auto-aborts if the site starts failing. It is a spot-check, not a full stress test.
Yes. Synthetic checks drive a real browser through a journey such as log in, click through, or add to cart, and assert what should be on the page. Start from a login template, store credentials encrypted, and pick selectors from your own page. If a step fails, the site is marked down and a screenshot is saved at that step.
Yes. Download the monitoring agent for Windows, macOS or Linux. It checks localhost, VPN and office-network sites from your own machine, then sends the results back so alerts and the dashboard stay in one place.
Not for a public website. Paste the URL and you are done. The agent is only for sites your network hides from the cloud.
Yes. Generate a key under API Access and send it as X-API-Key. You can read websites, status and uptime, and schedule or cancel maintenance, including for a team.
No. The free plan starts without one.
Set up monitoring in under a minute. Free forever, no card required.

Log in to your WebChecky account
Don't have an account?
Start monitoring your sites in under a minute
Already have an account?
Are you sure you want to disconnect this integration?
You will stop receiving notifications through this channel.

 Slack Bot
 Microsoft Teams
 Discord Bot